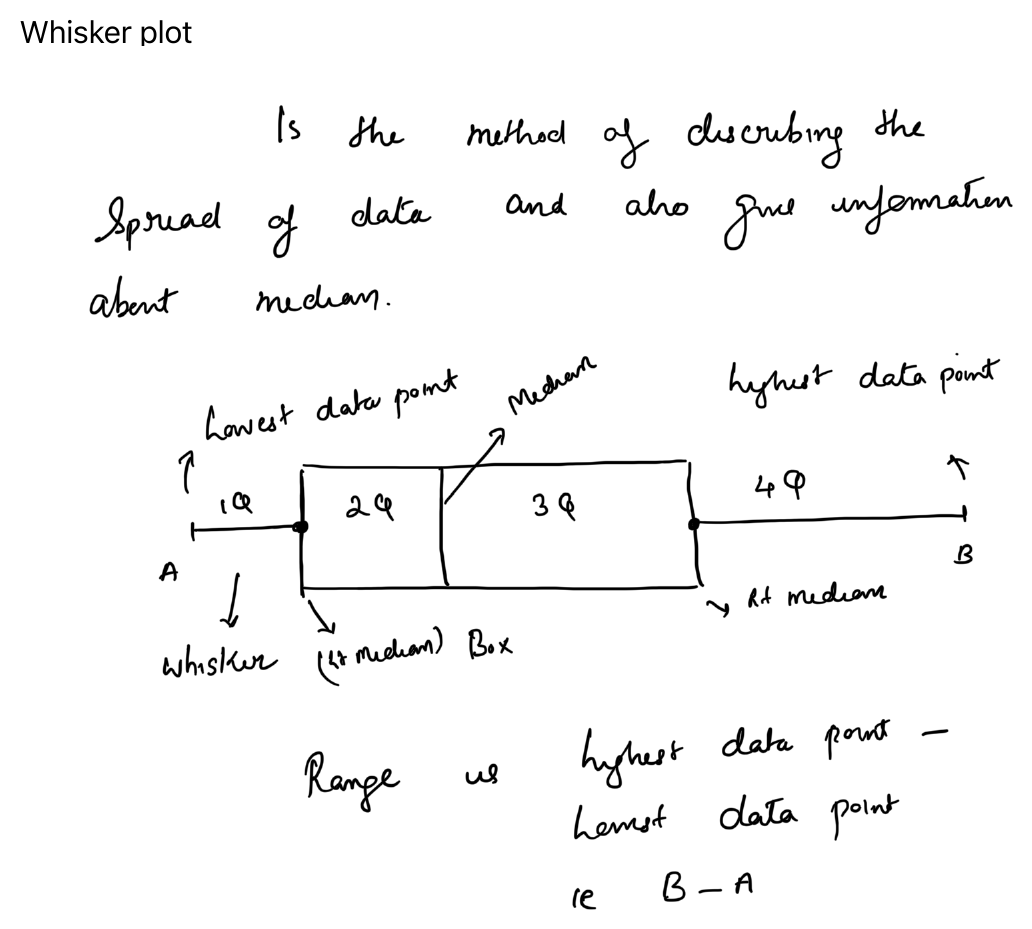
Definition
A whisker plot, or box-and-whisker plot, is a graphical method of displaying the distribution of continuous data. It summarises the spread of the data and gives information about the median and possible outliers.
Components
A standard box plot displays the five-number summary:
- Minimum value
- First quartile (Q1)
- Median
- Third quartile (Q3)
- Maximum value
Box
- The box extends from Q1 to Q3.
- The width of the box therefore represents the interquartile range (IQR).
- The line inside the box represents the median.
Whiskers
- The whiskers extend from the box toward the lower and upper data values.
- Depending on the plotting convention, whiskers may extend to the minimum and maximum or to the most extreme non-outlier values.
Interpretation
A box plot allows quick assessment of:
- Central tendency by the median
- Spread of the middle 50% of the data by the IQR
- Overall spread of the data
- Skewness if the median is off-centre or whiskers are asymmetrical
- Possible outliers
Key formulas
- Range = maximum − minimum
- Interquartile range = Q3 − Q1
Uses
- Comparing distributions between groups
- Identifying outliers
- Demonstrating spread and variability more clearly than a single mean value
Diagram