Definition
Correlation describes the strength and direction of association between two variables.
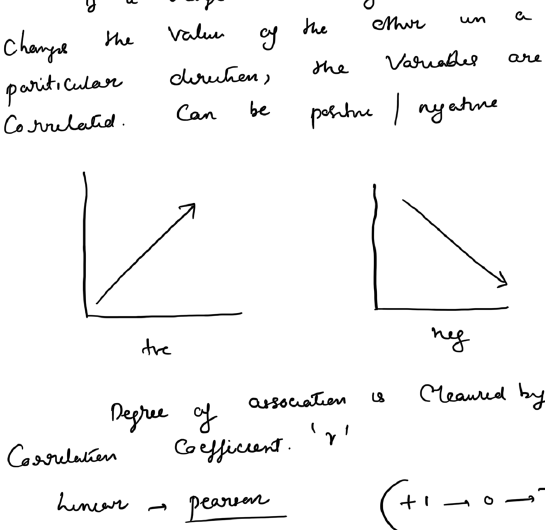
Correlation coefficient
The correlation coefficient ranges from -1 to +1.
- +1: perfect positive correlation
- 0: no linear correlation
- -1: perfect negative correlation
The closer the magnitude is to 1, the stronger the association.
Pearson correlation
Pearson's correlation coefficient is used for the linear association between two continuous variables when its assumptions are reasonably satisfied.
Spearman correlation
Spearman's rank correlation is a non-parametric measure based on ranks. It is useful for ordinal data or when the relationship is monotonic but the assumptions for Pearson correlation are not met.
Correlation does not imply causation
A strong correlation does not prove that one variable causes the other. Confounding, reverse causation and coincidence must be considered.
Regression
Regression describes the relationship between an outcome and one or more predictor variables and can be used for estimation or prediction.
In simple linear regression:
y = a + bx
where b is the slope and a is the intercept.
R-squared
R² is the proportion of variability in the outcome explained by the fitted regression model. A higher R² indicates that more of the observed variation is explained by the model, but it does not establish causation or model validity.
Statistical significance
The p-value assesses compatibility of the observed data with the null hypothesis. It does not measure the strength or clinical importance of an association.