Item Analysis
Moodle Quiz Statistics – Key Calculations
A. Quiz-Level Statistics
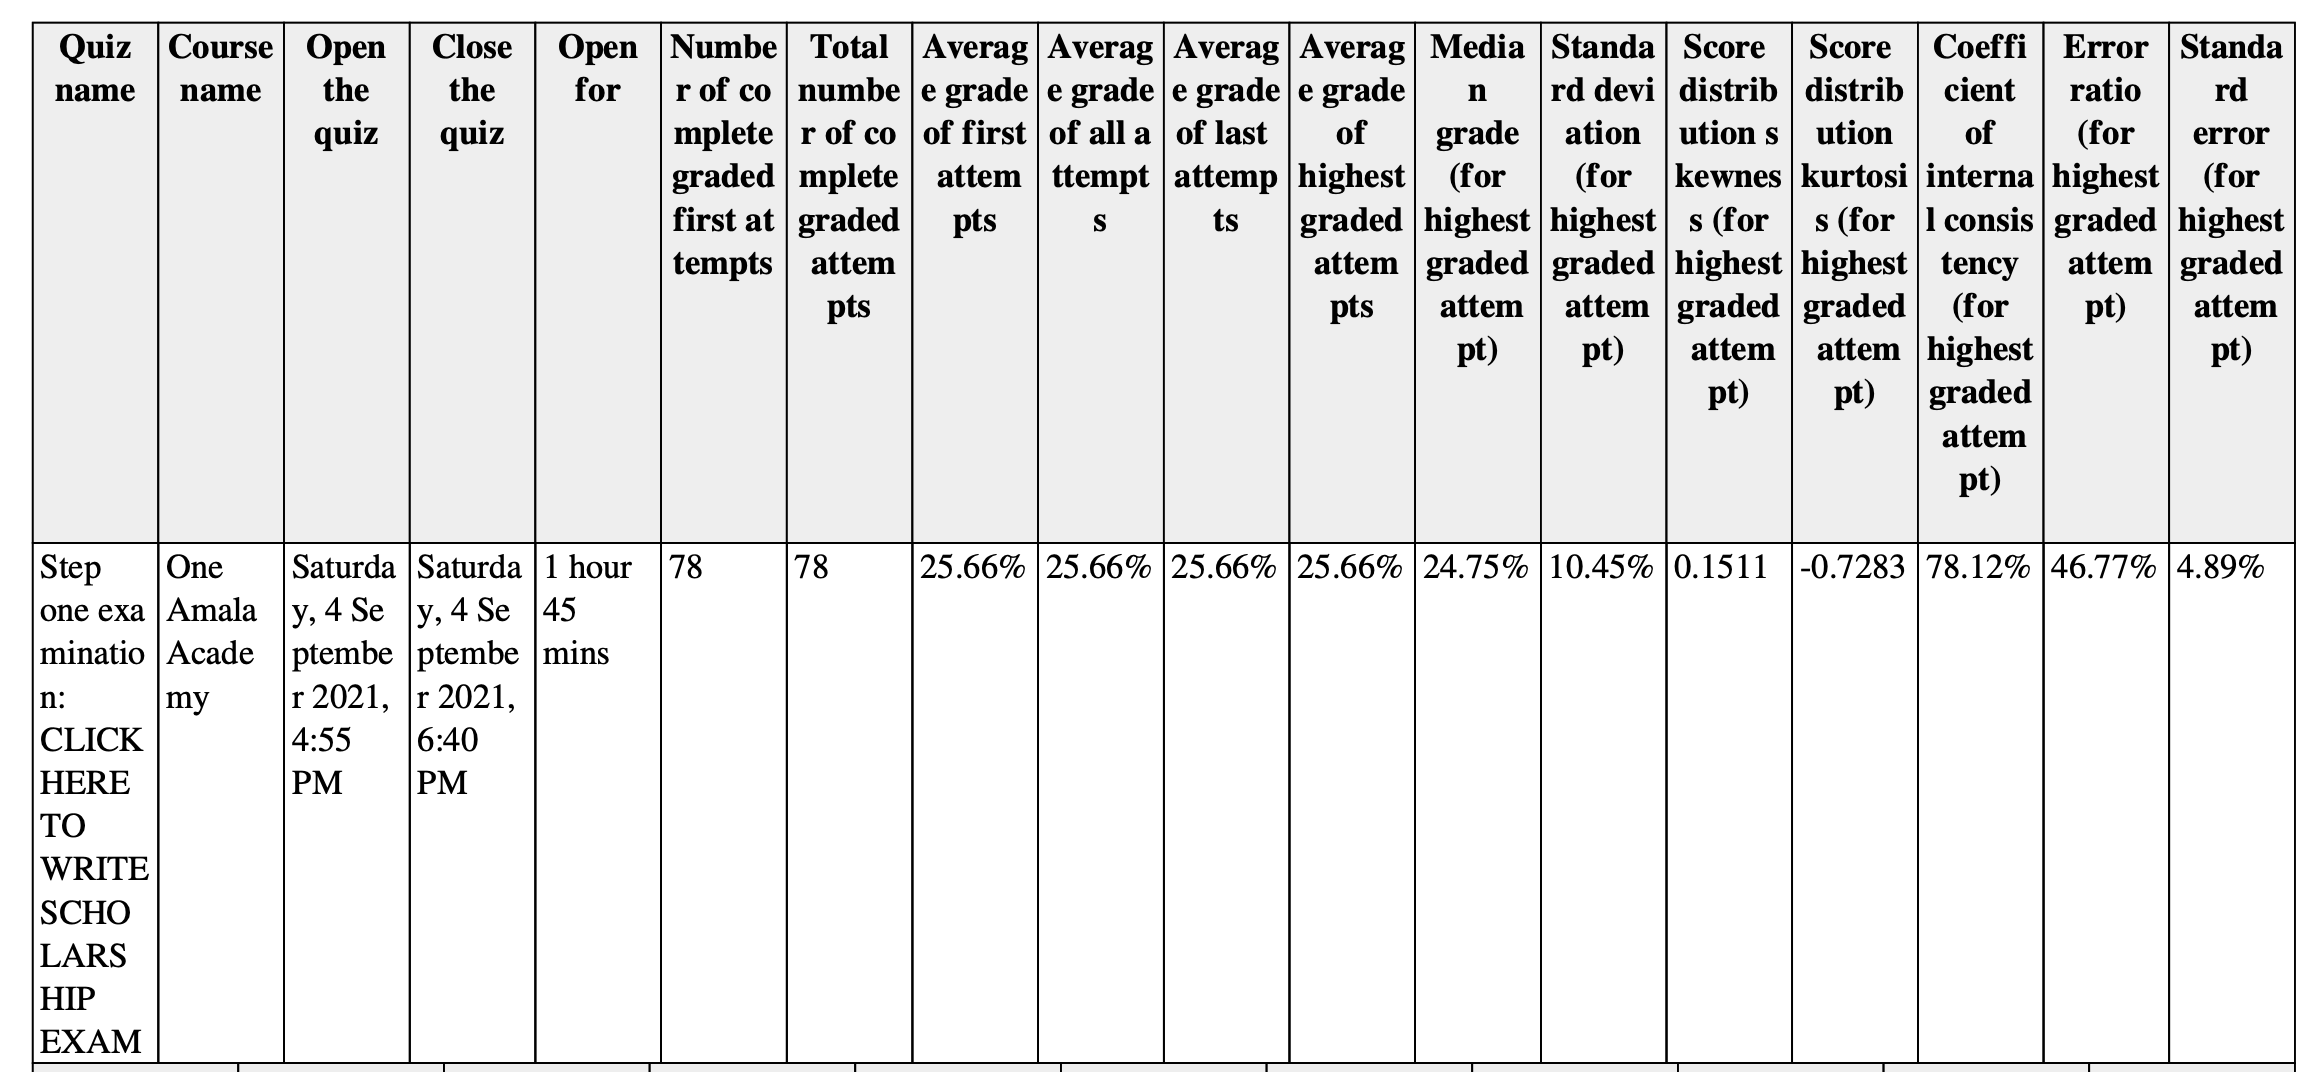
These describe the overall test performance:
| Metric | Meaning / Formula |
|---|---|
| Average grade | Mean score across all attempts. |
| Median grade | Middle score when all are ordered. |
| Standard deviation | Measure of score spread — higher values = more variation. |
| Skewness | Direction of score distribution (positive = most scored low). |
| Kurtosis | Sharpness of the score distribution peak. |
| Cronbach’s alpha or Coefficient of internal consistency | Internal consistency of the quiz (≥ 0.7 indicates good reliability). |
| Standard error | Standard deviation of mean scores (precision of measurement). |
| Error ratio | Relative measure of error = (standard error ÷ standard deviation). |
B. Question-Level Statistics (Item Analysis)
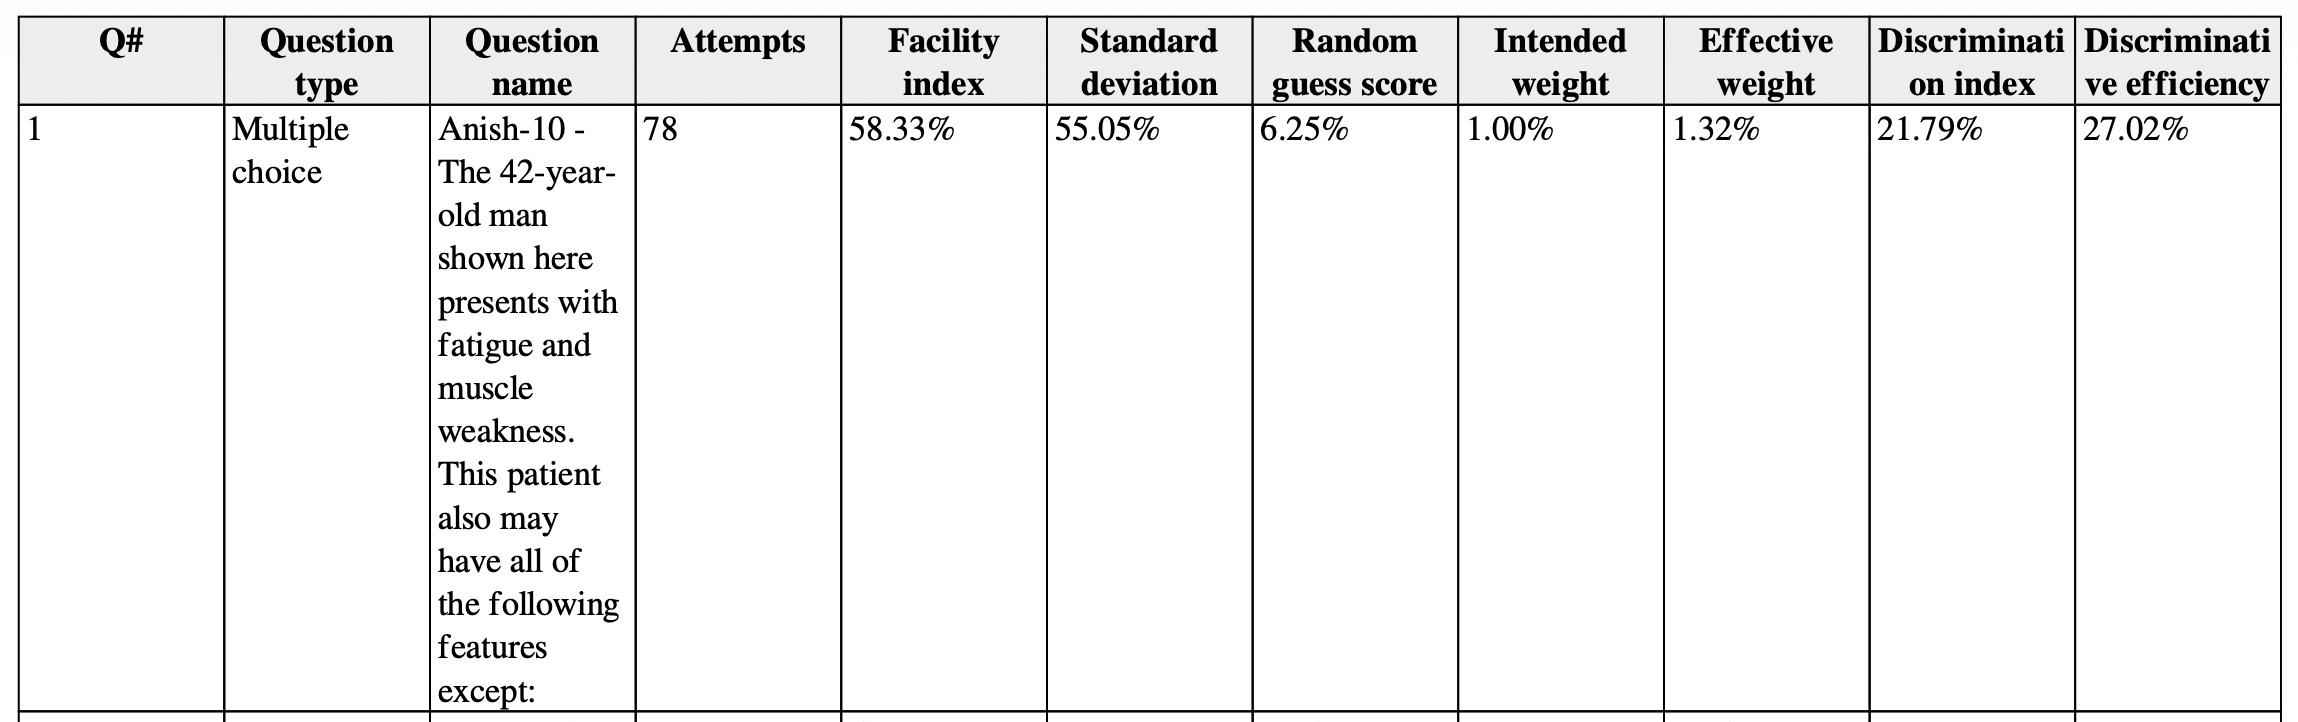
For each question (item), Moodle calculates:
| Statistic | Description |
|---|---|
| Facility Index (Difficulty Index) | Mean score for the question ÷ maximum score. Range: 0 (very hard) → 1 (very easy). |
| Standard deviation (per item) | How widely scores vary for that question. |
| Random guess score | Expected average if students guessed randomly. |
| Intended weight | Weight assigned to the question (in % of total quiz). |
| Effective weight | Actual statistical influence of that item on total score. |
| Discrimination Index (DI) | Measures how well the question differentiates between high and low scorers (difference between top and bottom 27%). |
| Discrimination Efficiency (DE) | Ratio of observed discrimination to maximum possible discrimination. |
For quick decision
| Index | Ideal Range | What It Means |
|---|---|---|
| Facility (Difficulty) | 30–70% | Balanced question |
| Discrimination | ≥ 0.25 (preferably >0.35) | Distinguishes strong vs. weak students |
| Discrimination Efficiency | > 50% | Indicates question performing near potential |
# Facility index (Multiple choice)
- [x] 30-70% is the aim
- [x] Difficulty index
- [x] mean/max score
- [ ] Discrimination index